hichart_PowerBI_Start

    Reporting Studio for Power BI Comprehensive and seamlessly integrated

    Are you using Microsoft Power BI as your company's business intelligence platform? If so, you've made an excellent choice. Reporting Studio for Power BI makes it easy for you to apply a consistent notation and visualization concept to your dashboards and gain a whole new level of insight from your data.

    Reporting Studio for Power BI is far more than just an add-on for extra graphics. Its extensive functionality enables you to transform your dashboards into powerful reports in the blink of an eye.

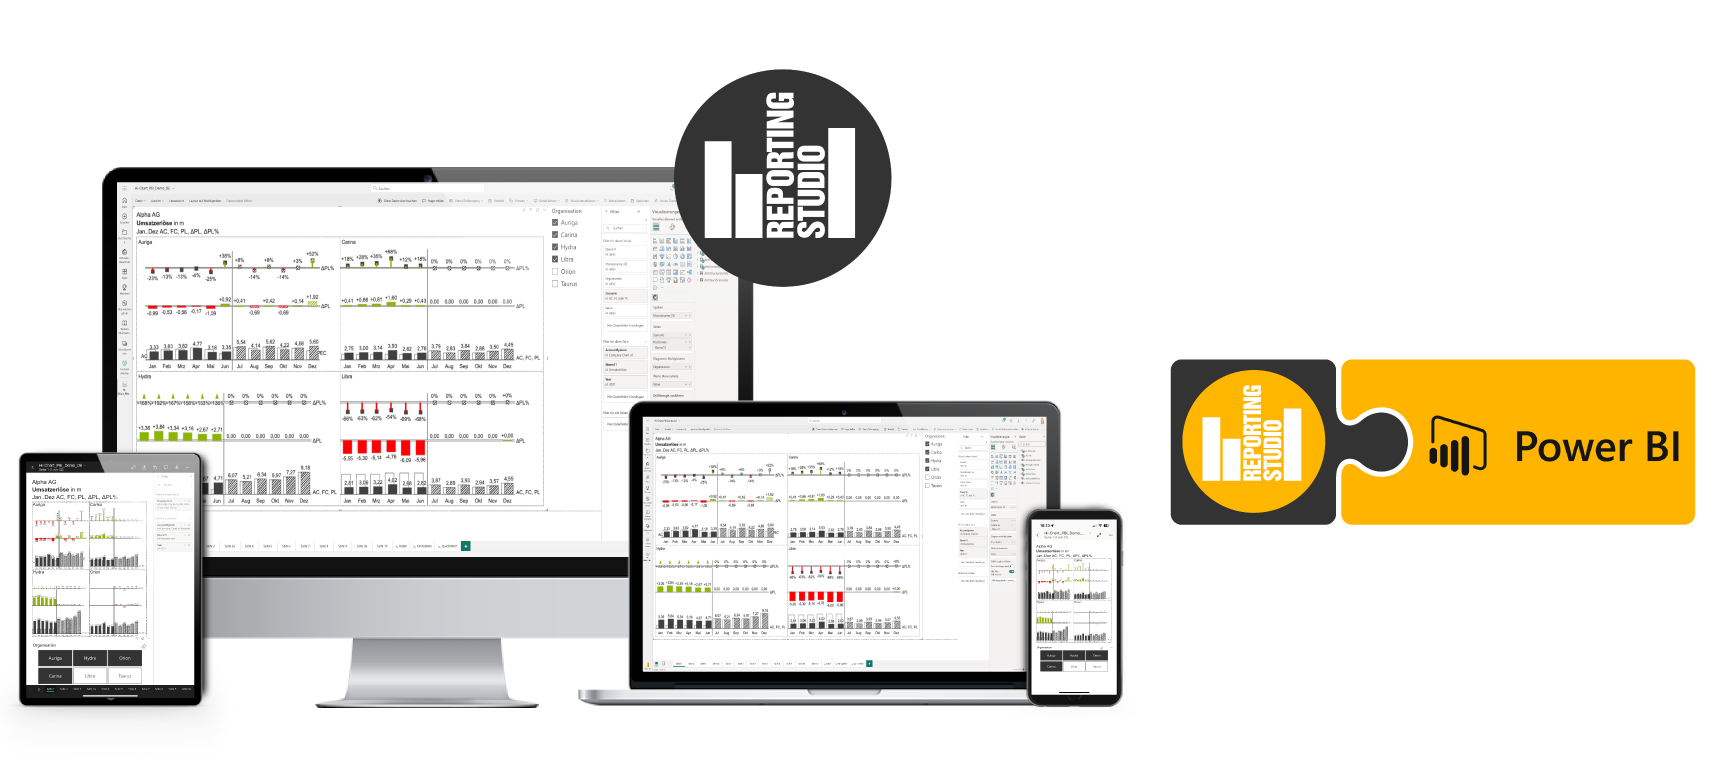
    Simply get Reporting Studio from the AppSource for Power BI visuals, add it to your Power BI environment, and start using it straight away.

    • Object sizing feature for perfectly scaled business graphics
    • Integrated notation concept for absolute clarity
    • Intuitive drag-and-drop operation for a quick start

    Three steps to your finished graphic

    Here's how it works

    PowerBI-Step1-EN
    PowerBI-Step2-EN
    PowerBI-Step3-EN

    Video tutorial

    Reporting Studio for Power BI Advantages

    More clarity and content for your dashboards
    Transform your dashboards into dynamic reports that follow clear design principles with Reporting Studio for Power BI.

    Full integration
    The Reporting Studio custom visual is fully integrated in Microsoft Power BI. Continue using Power BI functions such as filtering, cross-filtering and cross-highlighting.

    Numerous output options
    Export your Reporting Studio for Power BI visuals as PowerPoint presentations and PDF documents.

    Centrally stored settings
    All settings made within a Reporting Studio visual are stored centrally in the parent Power BI project.

    Licensing and delivery
    Reporting Studio for Power BI is licensed via Microsoft AppSource or with a separate licence key.

    Available across the platform
    Reporting Studio is available across the entire Power BI platform, including Power BI Desktop, Power BI Service (Cloud), Power BI Report Server, Power BI Mobile Apps (iOS & Android), Power BI Embedded, and Publish to Web.

    Multilingual by design
    Reporting Studio speaks many languages, including English, German, Spanish, French, Italian, Dutch, Portuguese, Russian, Serbian and Chinese.

    Live demo

    Graphic objects + highlighting

    HC_PowerBI-Step3

    Basic chart types

    • Unstacked columns and bars
    • Stacked columns and bars
    • 100% stacks
    • Waterfalls
    • Point and line charts
    • Area charts for stacked point-lines
    • Tables
    • Multi-charts

    Variance chart types

    • Columns and bars for simple delta variances
    • Waterfall columns and bars for cumulative variances
    • Needle chart type for percentage variances

    Highlighting and controls

    • Comments (comment reference number and external text)
    • Value indicator (highlights a value in the graphic)
    • Difference indicator (highlights the difference between two values)
    • Scaling indicator (highlights scaling differences between multiple charts)
    • Text box as HTML box to display static texts, images and other multimedia content

    Your contact person

    Beatrice_Daub

    Beatrice Daub

    Digital Sales Manager