Reporting Studio – Your business report is just a few clicks away
Create professional management reports, presentations and interactive dashboards in no time at all with Reporting Studio. Thanks to its intelligent recognition of business data and context, the tool instantly recommends the best visualizations for your business figures, turning them into clear, compelling graphics. Transform these visualizations from the generated charts and tables into easy-to-understand analyses and comprehensive business reports – complete with highlighting, comments and key messages – with just a few clicks.
Reporting Studio is IBCS®-certified and automatically applies globally recognized best practices in business communication, which ensure clarity and comprehensibility in business reporting.
Reporting Studio for Corporate Planner, Power BI and QLIK Sense
Demo
Let your reports speak for themselves with Reporting Studio from hi-chart


Highlights
Perfect proportions
The Reporting Studio object sizing concept ensures that all chart objects and labels are always displayed in the correct proportions to fit perfectly into the available space.
Automatic visualization suggestions
Reporting Studio analyses the business significance of your data and automatically recommends the best visualizations using the tried and trusted IBCS notation principles. You can also explore its extensive library for other visualization options.
Dynamic drag & drop functionality
Simply drag your visual elements onto the page and then adjust them as desired. Switch directly between charts and tables, and add subcharts to enhance your visualizations.
A clear structure
Reporting Studio displays all objects in a hierarchical structure tree, providing a clear overview for easy selection. You can define global settings for the entire structure, which are then passed down to the individual data points.
Multidimensional data manager
The data manager organizes your data in various dimensions, sorting it by business significance, time, scenarios, calculation path and measures. It also displays the recommended visualizations for you.
Number cruncher
Reporting Studio automatically adds forecast or plan data to your actual figures to present the information in a meaningful context. If your data sources don't provide calculated variances, Reporting Studio will perform these calculations for you.
Custom notation concept
Use the Reporting Studio style sheet editor to define your own display styles, including logos, colours, line thicknesses and fonts.
High-resolution exports
PowerPoint, PDF and PNG exports are ready to print in top quality, perfect for large displays and instant printing.
Wide range of data sources
Reporting Studio imports data directly from Excel and CSV files, and from over 150 ERP systems using standard Corporate Planner integrations.
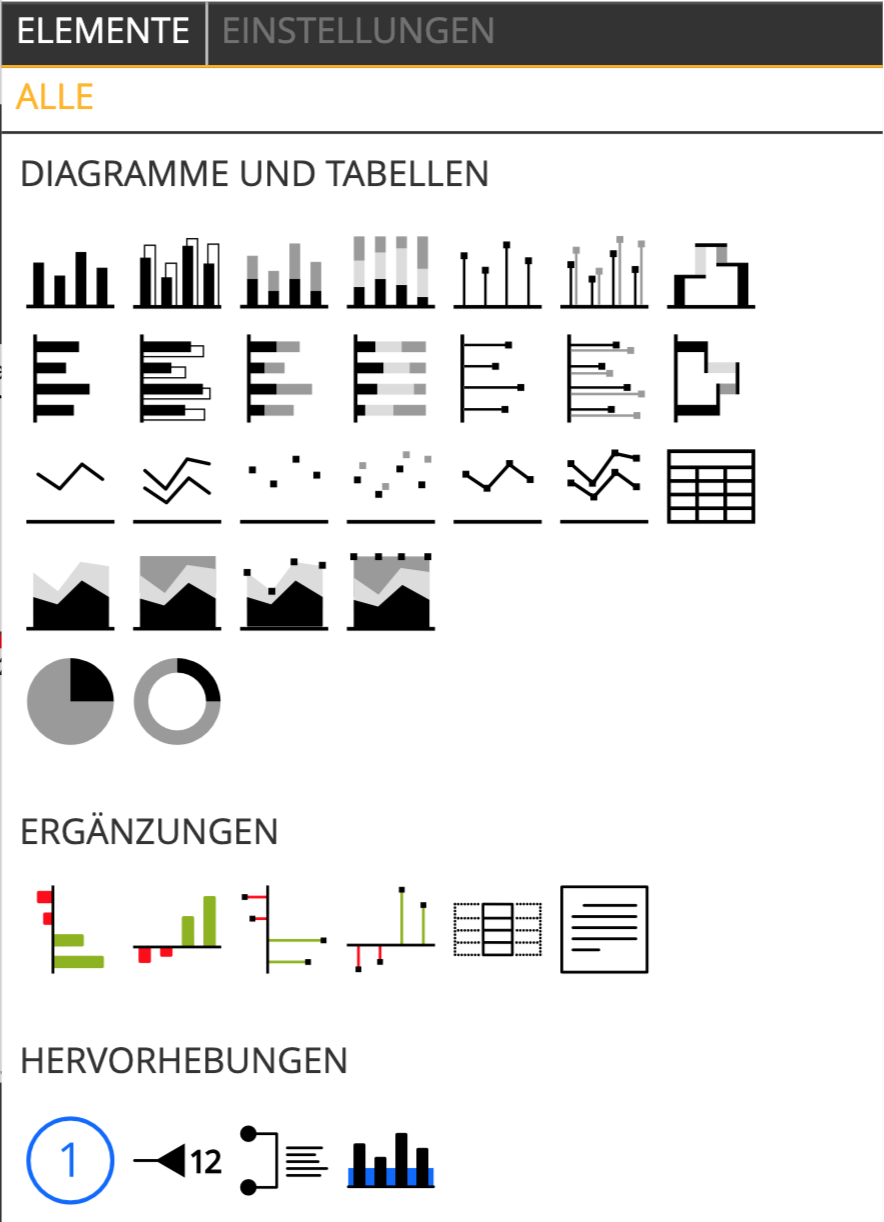
Graphic objects + highlighting

Basic chart types
- Unstacked columns and bars
- Stacked columns and bars
- 100% stacks
- Waterfalls
- Point and line charts
- Area charts for stacked point-lines
- Tables
- Pies and donuts
- Multi-charts
Variance chart types
- Columns and bars for simple delta variances
- Waterfall columns and bars for cumulative variances
- Needle chart type for percentage variances
Highlighting and controls
- Comments (comment reference and external comment text)
- Value indicator (highlights a value in the graphic)
- Difference indicator (highlights the difference between two values)
- Scaling indicator (highlights scaling differences between multiple charts)
- Text box as HTML box to display static texts, images and other multimedia content.
“With Reporting Studio, we can use the commenting feature to make our reports easy to understand, even for people without an economics background. The PowerPoint export provides us with clear and effective internal communication, too.”
BERTHOLD DIECKMANN, Head of Controlling
Diakoniewerk Essen


