Reporting Studio for Corporate Planner – Comprehensive and seamlessly integrated
Creating management reports can take a lot of time and resources – unless you have the right software for the job. Reporting Studio enables you to produce powerful reports and dashboards directly from within your familiar Corporate Planner environment with just a few mouse clicks. Combine the tried and trusted planning, corporate performance management and consolidation functions in Corporate Planner with a technologically advanced reporting system and generate clear and comprehensible analyses and reports in the blink of an eye.
Comprehensive visualization options Create tables, charts or combinations of both, and use these to create and update in-depth multi-page reports – whether for quick ad-hoc analyses or for your regular management reporting.
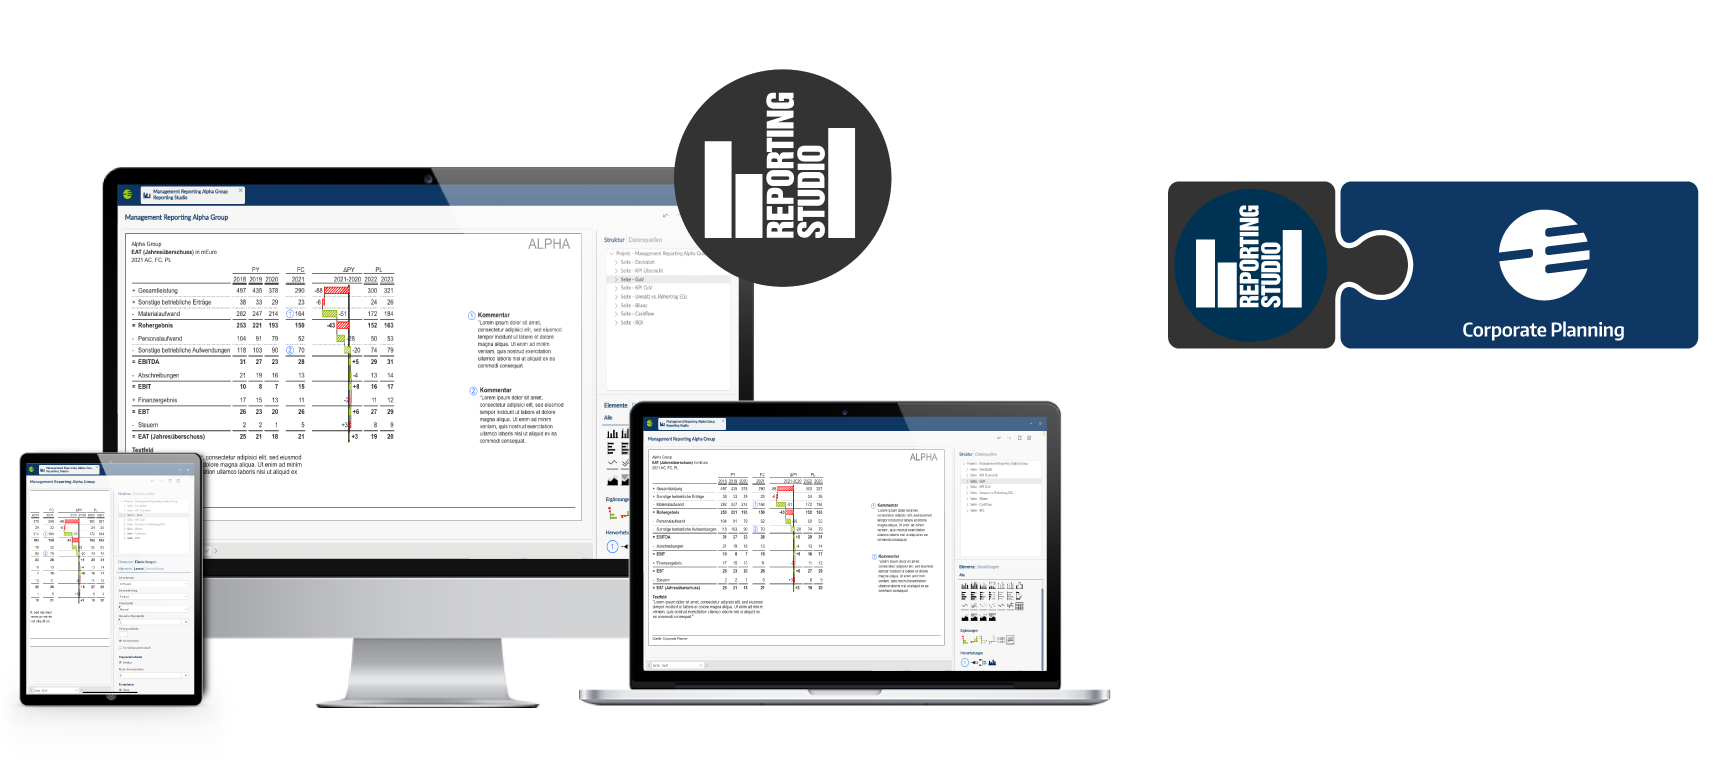
Combine planning with reporting Use Reporting Studio together with the Corporate Planner functions for planning, operational management and consolidation.
Seamless integration Reporting Studio is fully integrated with Corporate Planner and uses the CP Data Warehouse as its data source. More than 150 ERP systems can be connected directly via standard integrations.
Data source flexibility You can also import your data from Excel and CSV files.
Platform independence No need to install Reporting Studio on your computer – just log in via your web browser and start working. You can use it as an on-premises solution or in the cloud.
Centralized management of reporting projects Organize your reporting projects centrally in folders and distribute the reports using role-based shares in the Corporate Planner web client.
Advanced functionalities Take advantage of the integrated business logic, dynamic filters, IBCS scenario typing, currency conversion and group reporting features.
Role-based rights management Designers can create, modify and delete reporting projects, while viewers can view, export and filter them.
Customized design elements Define and update a customized notation concept for your company, including logos, colours and fonts, in a central style sheet.
High-resolution output Export your reporting projects in print quality as PowerPoint presentations, PDF documents and PNG image files.
Snapshots for the record Create snapshots of your project for a complete reporting history.
Web portal for easy access A browser-based portal provides user-specific access to all relevant content with individual sharing options.
Webcast: Get to know Reporting Studio
Learn how quickly and easily you can give your business communication an upgrade and create clear and comprehensible management reports and presentations.