hichart_CP_ReportingStudio_standalone

    Reporting Studio Standalone - comprehensive reporting solution, standalone platform

    The standalone reporting platform for all those who demand the highest standards of clarity and communication - and want to visualize their data independently of a planning solution and a BI platform.

    With Reporting Studio Standalone, you can create meaningful management reports and presentations directly in your web browser - flexibly, intuitively and completely independently of an existing planning solution and BI platform. The software is based on hi-chart's innovative visualization technology and offers you all the functions you need for precise, standardized reporting - without any connection to a planning solution.

    • Always perfectly scaled thanks to the object size concept
    • IBCS-certified solution for absolute clarity
    • Intuitive use via drag & drop for a quick start

    Demo

    Let your reports speak for themselves with the Reporting Studio from hi-chart

    HC_WS_Software-CP-Reporting-Studio_S1
    HC_WS_Software-CP-Reporting-Studio_S2
    HC_WS_Software-CP-Reporting-Studio_S3

    Advantages of the Reporting Studio Standalone

    Intuitive operation via drag & drop

    The Reporting Studiocan be operated without any training.With just a few clicks and drag & drop, you can createinformativereports - without any programming knowledge.

    Designing tables, charts and combinations

    Whether bar charts, tables or complex combinations: the visualization options are diverse and tailored to professional reporting requirements.

    Standardized and scalable for maximum comprehensibility

    Thanks to IBCS® certification and the automatic object size concept, all presentations are standardized, easy to understand and always optimally scaled - regardless of the medium or end device. This keeps your reporting clear, consistent and legible - from presentation to PDF print.

    Multi-page reports for ad hoc analyses or recurring reports

    Create individual report formats - whether spontaneously orregularly. Your reports can be updated and expanded at any time.


    Customizable StyleSheets for corporate design

    Colors, fonts, logos - the central notation concept allowsconsistentadaptation to your visual appearance.

    Platform-independent use in the web browser

    Reporting Studiodoes not require a local installation. The applicationruns in any modern web browser and isavailableboth as a cloud andon-premisesolution.

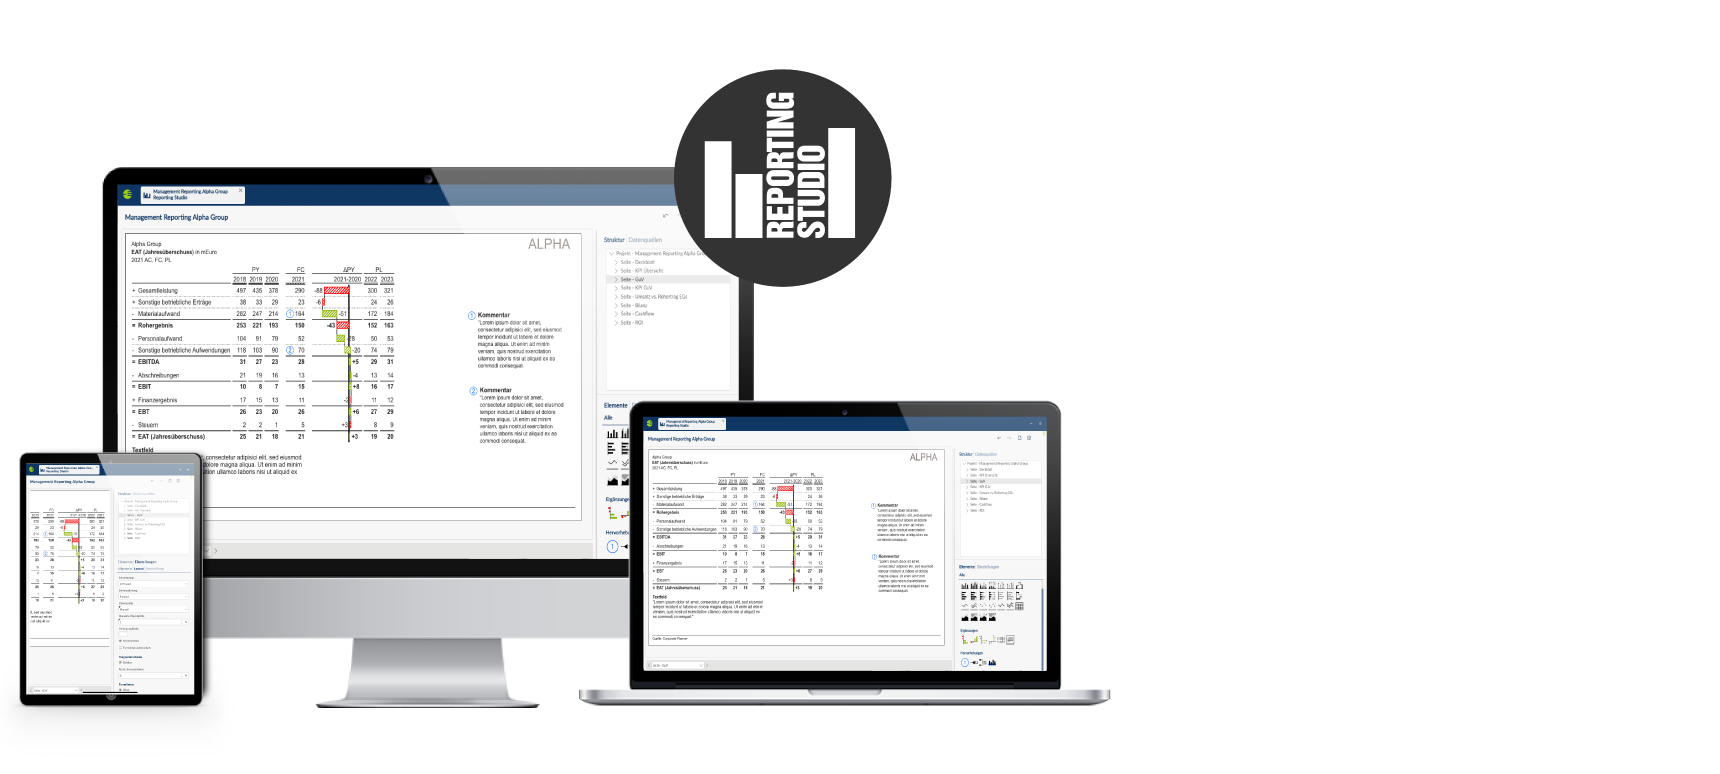
    Integrate data flexibly, present results professionally

    Data can be easily imported from Excel, CSV and around 200 ERP system sources- with more or less deep system integrationas required. The finished reports can then be exportedin high resolution as PDF, PowerPoint, Word or PNG and used ready for printing.

    Fine-grained rights management

    Distinguishprecisely between viewer and designer rights: Viewerscan filter and export reports, designers can edit andpublishthem.


    hi-chart_general_visual

    Webcast: Get to know the Reporting Studio

    Learn how to give your business communication an upgrade and easily create clear and understandable management reports and presentations.

    Graphic objects + highlighting

    HC_Graphic objects

    Basic chart types

    • Unstacked columns and bars
    • Stacked columns and bars
    • 100% stack
    • Waterfalls
    • Point and line charts
    • Area diagrams for stacked point lines
    • Pie charts for pies and donuts
    • Tables
    • Multi-charts

    Deviation chart types

    • Columns and bars for simple delta deviations
    • Waterfall columns and bars for cumulative variances
    • Integrated variances
    • Needle chart type for percentage variances

    Highlights and controls

    • Comments (reference and external comment text)
    • Value indicator (highlights a value in the chart)
    • Difference indicator (highlights the difference between two values)
    • Scaling indicator (highlights scaling differences between several charts)
    • Text field as HTML box to display static texts, images and other multimedia content

    Your contact person

    Beatrice_Daub

    Beatrice Daub

    Digital Sales Manager