Reporting Studio for Qlik Sense – Comprehensive and seamlessly integrated
Transform your dashboards into dynamic reports that follow a clear set of design principles with Reporting Studio for Qlik Sense.
Reporting Studio enhances your existing intuitive dashboard capabilities with new, easy-to-understand visualizations based on the widely recognized IBCS principles for effective business communication. Simply add key messages and comments to your dashboard displays to create powerful reports in the blink of an eye.
Reporting Studio for Qlik Sense is fully integrated in your familiar BI environment, so you don't need to learn another new tool – get started straight away.
ADD VARIANCES AND HIGHLIGHTING SIMPLY BY DRAG & DROP – DONE!
Reporting Studio for Qlik Sense – Advantages
More clarity and content for your dashboards Transform your dashboards into dynamic reports that follow clear design principles with Reporting Studio for Qlik Sense.
Customized design elements Adjust the global project style sheets to apply corporate design elements, such as logos, colours and fonts.
Advanced functionality Benefit from the Reporting Studio feature set on top of the Qlik Sense functions such as filtering and cross-filtering.
Full integration The Reporting Studio extension for Qlik Sense is fully integrated in Qlik Sense. All your settings in Reporting Studio are stored in the parent Qlik Sense app together with the extension itself.
Numerous output options Export your Reporting Studio graphics using the Qlik Sense standard functionality.
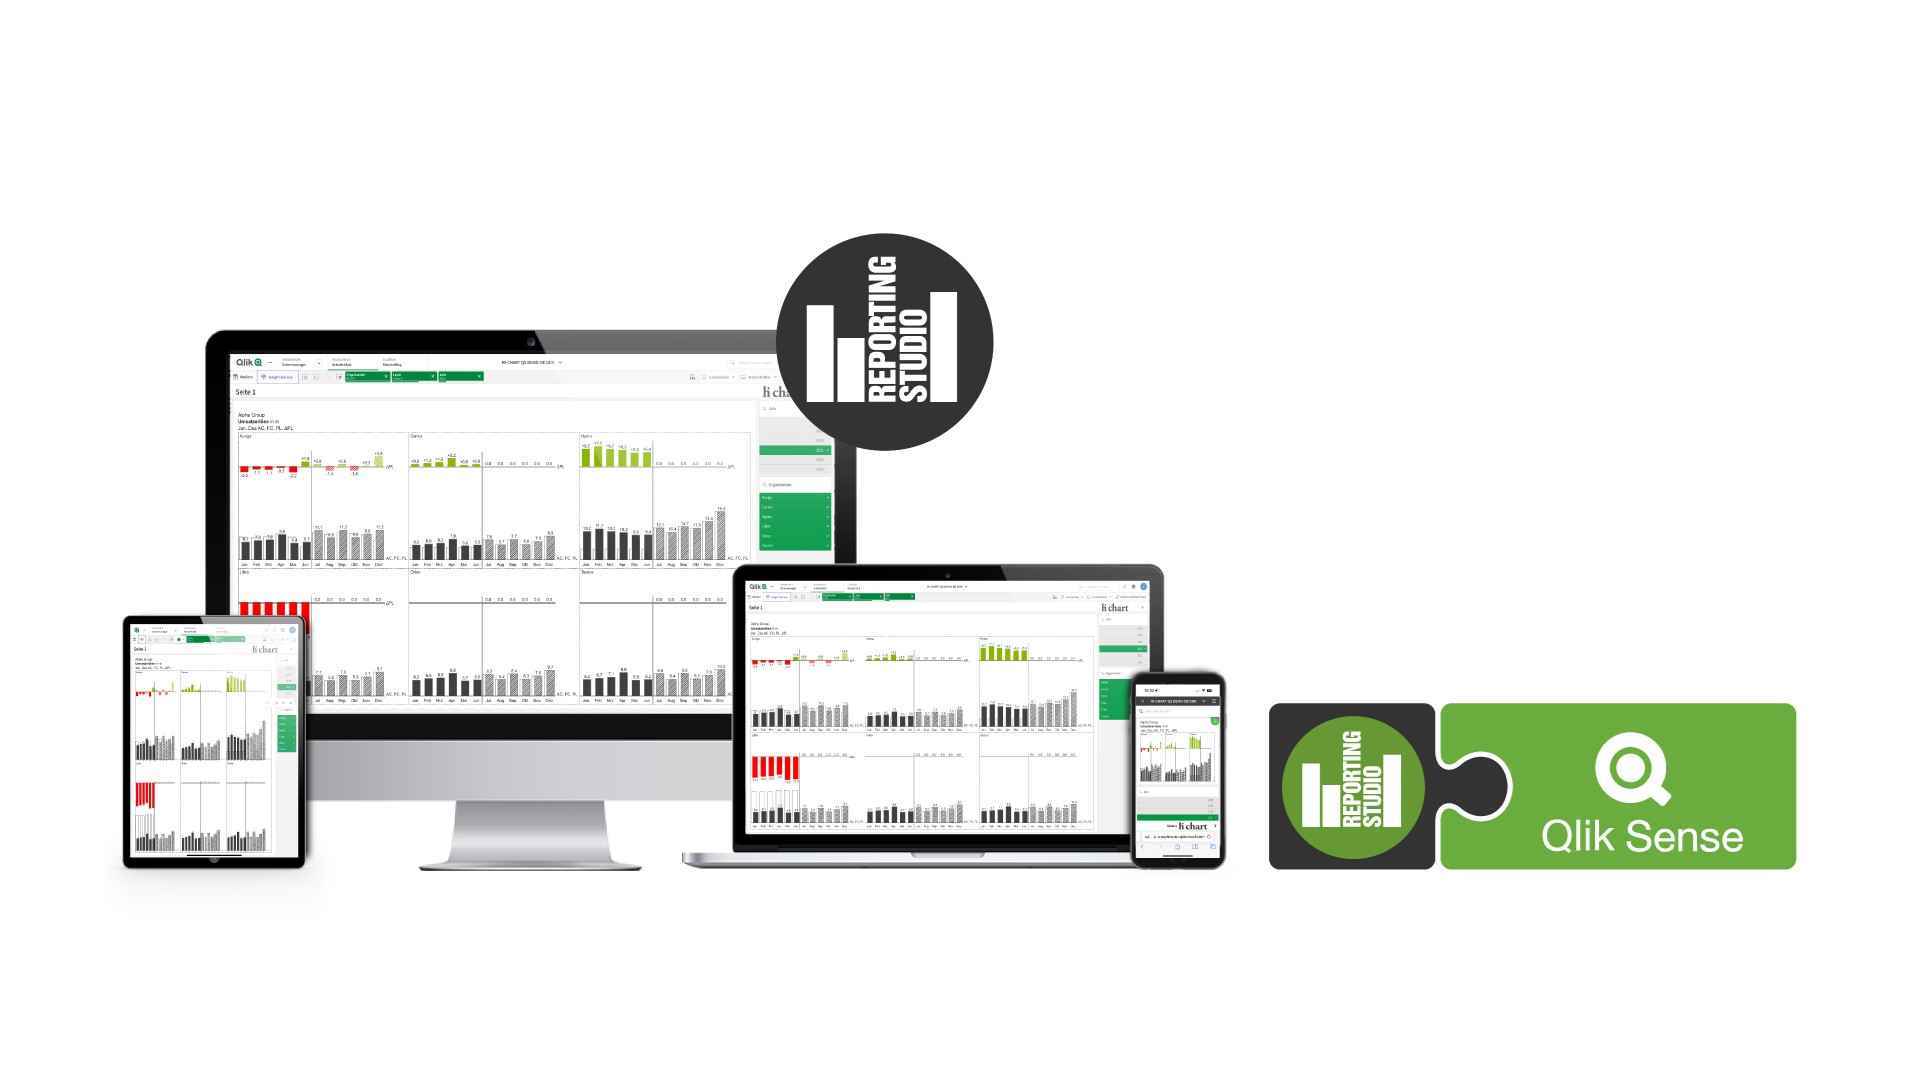
Available across the platform Reporting Studio for Qlik Sense is available across the entire Qlik Sense platform, including Qlik Sense Desktop, Qlik Sense Cloud (SaaS) and Qlik Sense On-Premise Server.
Multilingual by design The Reporting Studio extension supports many languages, including English, German, Spanish, French, Italian, Dutch, Portuguese, Russian, Serbian and Chinese.